The CRA Toolbox contains data, projections and risk assessment algorithms (contained in so-called “risk workflows”) designed to support the compilation of regional climate multi-risk assessments. It is written in English and structured to accommodate the needs of users at varying expert levels:
General information and visualization of hazards, exposure, and vulnerability is accessible via a dashboard, usable also for non-expert users;
Advanced users can explore and download pre-existing risk workflows for selected natural hazard profiles, and apply these workflows to a specific European region;
Expert users can create a fully customized regional risk assessment package allowing the inclusion of own local data on hazard, exposure, and/or vulnerability, and adjusted risk assessment methods.
The risk workflows in the toolbox are stratified by hazard profile. For a range of hazards types, a number of methods for risk assessment are included in the toolbox based on the type of hazard. Currently, we included methods for flood, drought, heatwave, wildfire, windstorm and snow. The different assessment methods follow a stepwise data processing scheme to calculate risk as a combination of hazard, exposure and vulnerability. In particular, we identified the following risk assessment methods:
- Expected damage calculated as a combination between hazard and damage curves, which are a function of exposure and vulnerability;
- Risk as a product of hazard, exposure, and vulnerability;
- Risk matrix, in which qualitative risk classes are defined based on hazard probability and impact;
- Assets or population exposed to a specific hazard.
The CLIMAAX toolbox comes with datasets of pan-European hazard, exposure, and vulnerability data for the implementation of the different risk assessment methods. These European datasets include reference hazard climatologies and basic climate change scenarios, and data on exposure and vulnerability such as land use, building types, age, education, income, healthcare access, settlements, and infrastructure. In general, similar exposure and vulnerability data are used in each of the hazard workflows. In some workflows multiple customized datasets and future scenarios of exposure and vulnerability are already made available.
The toolbox allows the users to customize their risk assessment and to upload their own data. In the expert level version of the toolbox customized risk assessment procedures can be implemented.
A full download of the technical guidelines and workflow code, jointly with the hazard, exposure, and vulnerability data, enable offline customization and execution of the climate risk assessment. In its current form, the toolbox has limited capability to perform online calculations. Options to offer facilities for online calculations are explored.
Conceptual overview of the toolbox structure
The conceptual setup of the toolbox is depicted in the figure below. The user is here envisioned as a baker (1) who goes to the bakery shop (2) with available ready-made workflows for specific risk assessments. The user then chooses a specific recipe (3) and brings it home to the kitchen (4). There, the user can try out the recipe, using the available data that is supplied, bring their own data in to the recipe (5), tailor the data as they see fit and modify the recipe to provide a new workflow resulting in a climate risk assessment specific to their needs (6). This new risk workflow can be provided back to the bakery helping other potential users and/or future applications.
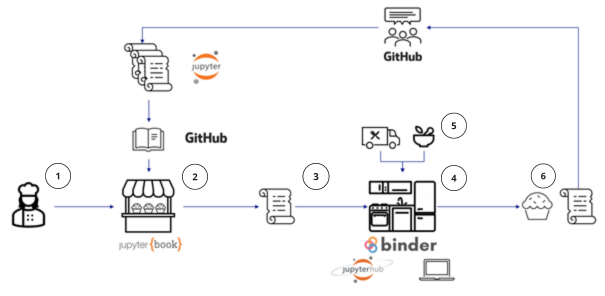
Mapping of the technologies used on the toolbox onto the user story of the CRA bakery.


The recipes (cookbooks), which are displayed in the handbook are developed in the form of Jupyter notebooks, open-source web applications that provide an interactive environment for creating and sharing documents that combine live code, narrative text, visualizations, and other rich media.

The three expert levels of the toolbox are represented by three different kitchens are envisioned for the users. For the new users of the online kitchens, support and training are provided.
Free and open public computational service provided by MyBinder service where users can explore the workflows without having to register, download and install anything. Links to each workflow are available thought the CRA book.
CLIMAAX JupyterHub, a collaborative infrastructure and environment is available for the selected regions participants of the Open Call. It is possible to store users’ local data and climate risk assessment output in the JupyterHub.
Local computers – all the workflows can be downloaded, adapted and used locally.
The shops for ingredients (the data) – Access and support for using pan-European datasets regarding hazard, exposure and vulnerability is available through the toolbox, such as:
- Copernicus Climate and Atmospheric Data Store for access to past and future climate and atmospheric hazard data;
- Global Human Settlement Layer for access to exposure data, for instance population and settlement types;
- Global Data Lab for access to vulnerability data such as education levels and income.
It is possible to upload and use local data and data from other sources as well. The operational version of the toolbox will contain an additional set of Jupyter notebooks with extensive descriptions and examples of the datasets used in the workflows.
Example of user journey
A user who wants to do a specific climate risk assessment for their area can start from one of the workflows in the workflow collection in the CRA book. One example workflow involves a flood risk assessment that analyzes expected flood damages for different levels of flood extent, expressed as return periods. In each workflow the user can read basic information about the data that is used. The basic workflow would be:
0. Prepare the application;
1. Access the needed data;
2. Calculate or assess the return period (hazard);
3. Combine the hazard data with exposure and vulnerability data to assess the risk;
4. Assess the future climate risk.
Step 0
Step 0 in the process is prepare the application to be able to run the notebooks. This step consists of several tasks, such as loading the needed code libraries (see the figure below) and setting up the file structure. Each step in this process is described in detail in the notebook.
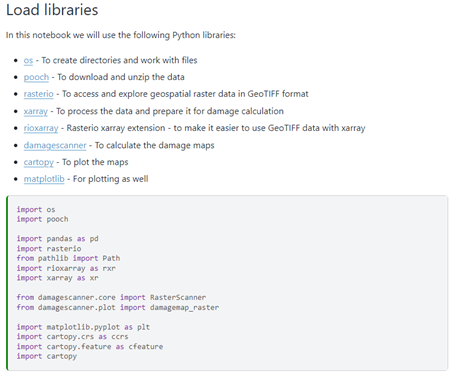
Screenshot of instructions how to load the libraries needed for the specific workflow.
Step 1
The next step is to access and explore the data. The links to the origins of the datasets are provided for each of the datasets used. This is illustrated in Figure 3. In this particular case the user has access to hazard data (flood extent), land use information, flood damage curves and affected population. If new to the data, the users will be able to explore each data set in depth with data notebooks in the “Explore data” section. Common queries and questions will be explained within this section. Similarly, the links to the documentation of each library used in the workflow are provided, so users can learn more about them if they want to expand the workflow or better understand the code in the workflow. In this example the user is using pre-existing data, but the idea is that the user adds their own data here, a process that will be supported with guideline (still under development).
Step 2
The user now has the data needed and can calculate the hazard. In this example the return period of the flood is the target variable, and this has here been pre-computed by the JRC and provided as a dataset. However, the user can create their own type of hazard, for example using a different method to provide the expected hazard, through a different hydrological model. We will provide basic tools for this type of calculations, e.g. how to assess return periods and provide information on how to process model output from other sources. This step also contains information on how to manipulate the data, such as cutting out regions, interpolation and averaging in space and time.
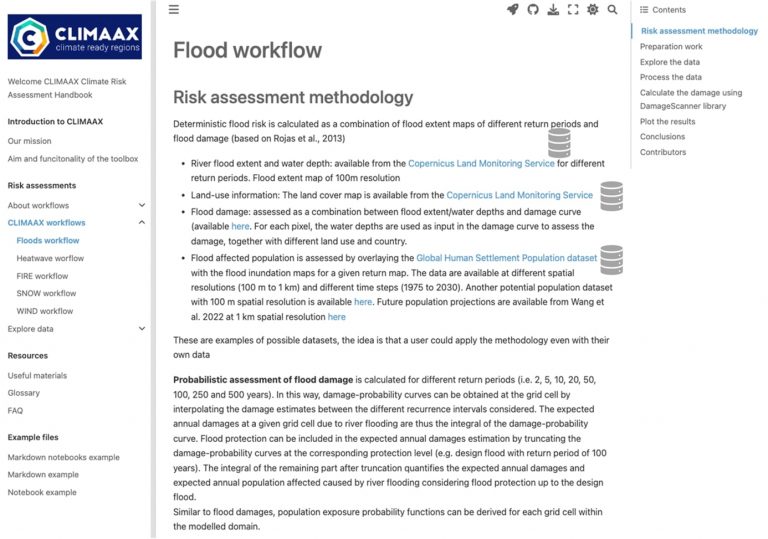
Example of a workflow in the Climate Risk Assessment book – view of the data description with links to the data origins.
Step 3
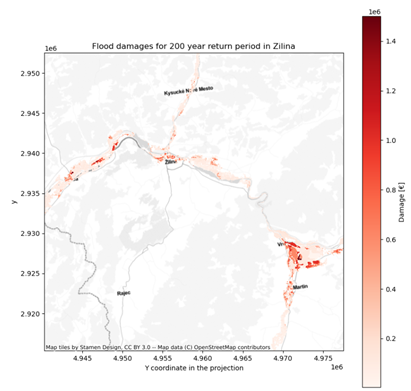
Once the hazard is calculated, the next step is to provide the risk assessment. Using the hazard maps, these can now be combined with the exposure and vulnerability data to create the risk information. The user will here be able to fully explore the risk from several angles, for example exploring different exposure (buildings, infrastructure etc.) and vulnerability (population, economic value) factors for their particular interest.
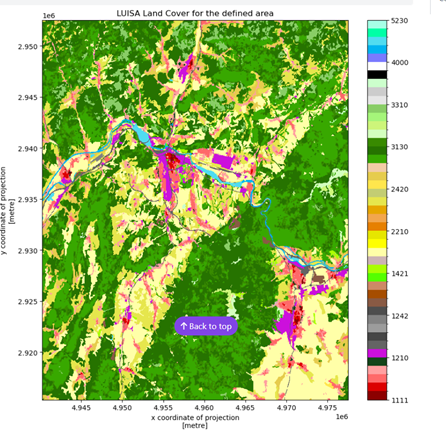
Example of a cut-out of a specific region of a land-use map: the user can run snippets of the code to see the results in real-time and modify the code, for example the geographical boundaries of a cutout of a map.
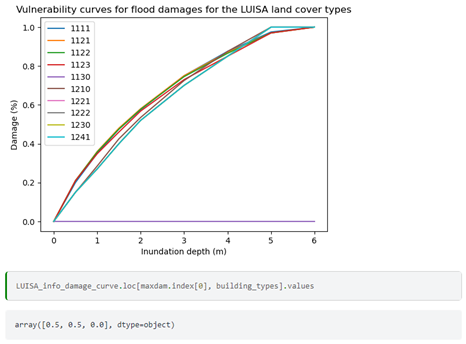
The figure above shows an example of vulnerability curves for flood damages related to land cover types.
Step 4
The final step in the CRA is to assess the future risk due to climate change. The toolbox will provide tools on how to handle the climate data and provide guidance in selecting potential future scenarios. The main data for this will be the global climate models that are run as part of the IPCC CMIP6 scenarios (Figure 7). These climate model scenarios are quite coarse, and other downscaled datasets of higher resolution are envisioned to also be used, such as the CORDEX projections over Europe. These functionalities are currently under development, and the main source of the climate change projects will come from the Copernicus climate and atmospheric data store (CADS).
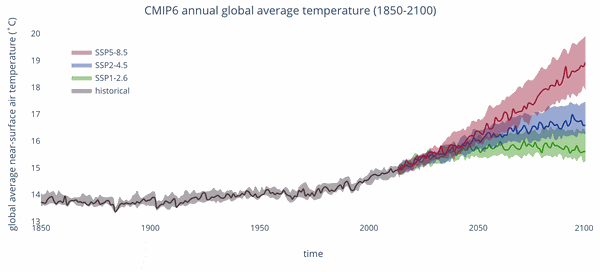
Future climate projects of the CMIP6 global climate models for three different scenarios.
Additional resources
Based on the desired activity performed by the toolbox (see section of type of users), sufficient expertise is required to operate the toolbox. Users familiar with Python tools for geospatial data analysis and processing should be present in the local community using the CLIMAAX toolbox, or added as a consultancy service to the consortium.
However, an extensive list of additional resources is available for the users that lack knowledge in one or more domains needed to use the toolbox. This includes resources about:
- FAIR principles for data and software;
- Git and GitHub;
- Python;
- The Jupyter ecosystem;
- Scientific Python libraries.
This list will be expanded with the links to the new Copernicus Climate and Atmosphere Data Store (CADS) toolbox documentation and tutorials as they become available, as well as any other resource that is used in the toolbox based on the participants’ feedback.